News Release
UC San Diego Energy Dashboard to Help Campus Curb Appetite for Power
San Diego, March 29, 2010 -- After an extensive period of testing, researchers have launched an Internet portal to showcase the real-time measurement and visualization of energy use on the University of California, San Diego campus.
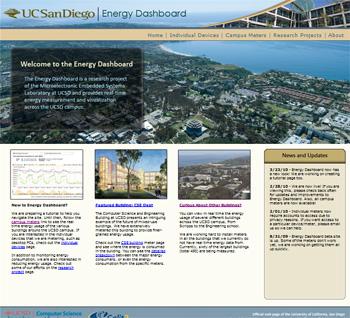
The UC San Diego Energy Dashboard (http://energy.ucsd.edu/) allows users to see up-to-the-second information on a structure-by-structure basis for 60 of the largest buildings on the La Jolla campus. The data is provided by UC San Diego Physical Plant Services from over 200 energy meters providing energy usage at the building level. The portal also features information coming from roughly 40 individual power meters that measure energy consumption in the office, e.g., a computer and monitor drawing power from a single socket. A denser deployment of meters, which would measure and display individuals’ energy use, is currently under planning and development.
 |
| Home page of the UC San Diego Energy Dashboard |
The Energy Dashboard grew out of a simple premise. “If you cannot measure energy use, you will not be able to make much headway in reducing your energy footprint,” said Yuvraj Agarwal, a Research Scientist in the Jacobs School of Engineering’s Computer Science and Engineering (CSE) department.
“Energy models of buildings are decades old, and nobody was looking to see if those were still valid,” added Agarwal, principal architect of the dashboard. “People tend to think that by shutting off the lights in an office, they’ve done their part for the environment. In fact, our measurements indicate that personal computers can account for almost 25 percent of energy consumption of a building, and most of the time, these PCs are turned on but are not actually in use. If you also include servers and data centers, the contribution of so-called IT equipment can be a staggering 50 percent of total baseline energy use, because a lot of the energy is used during nights and weekends when utilization for these PCs and servers tends to be very low.”
The tools available on the Energy Dashboard include real-time power measurement of the entire UCSD campus; energy consumption for each building; and power usage of individual devices such as PCs and servers that are plugged into electrical sockets in some CSE offices. The campus meters are all viewable by the public, but access to the individual meters is currently restricted to the owner of that meter (for privacy reasons).
The Web portal provides statistics updated at least once every minute on total power consumption, power generation, imports from San Diego Gas & Electric, and a comparison between power usage and production. (UC San Diego produces about 82 percent of its annual energy load using 1.2 megawatts of electricity from photovoltaic panels and a 30-megawatt natural gas-fired co-generation plant.) To locate energy-use data on each building, visitors to the Energy Dashboard can select the UC San Diego School of Medicine, Scripps Institution of Oceanography, or any of the university’s six undergraduate colleges (e.g., both the CSE Building and Atkinson Hall are located on the Warren College campus).
The new portal grew out of research that took advantage of the CSE building’s green features, including four building sub-meters and 16 individual circuit meters installed over the last year. Working with his Ph.D. advisor at that time, Jacobs School of Engineering computer science and engineering professor Rajesh Gupta, Agarwal sifted through the data from the mixed-use CSE building and three others that are typically found on a research university campus: a residence hall, a data center, and a research building with energy-intensive clean rooms for nanofabrication—the Atkinson Hall headquarters of the California Institute for Telecommunications and Information Technology (Calit2).
 |
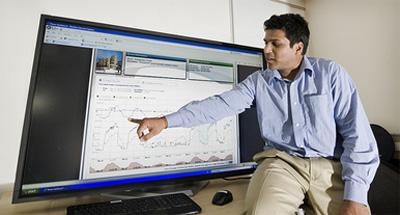
| Dr. Agarwal points to real-time data on the Energy Dashboard. |
The researchers were able to identify where peaks in energy consumption came from and the primary components of baseline energy use – including IT’s large energy drain even when computers were not in use (e.g., at night or on weekends when the computers are often left on, just in case the user ever wants to connect in remotely or they are running a background application that requires the machine to be powered on).
“Buildings with a large IT footprint can therefore reduce consumption significantly by decreasing their base energy load,” concluded Agarwal. “Our ability to look at energy use in fine detail gave us greater insight about how to reduce power consumption significantly in these campus buildings. To do that, you have to create effectively duty-cycled buildings.”
Duty-cycling is a computer term that refers to the fraction of time that a computer or telecommunications system is in an ‘active’ state as compared to a low-power ‘sleep’ or an off state. The challenge with duty-cycling is lack of availability. To achieve availability even when the system is sleeping, Agarwal effectively created a ‘hybrid’ active-passive state for power-managed systems. In the case of a building, says Agarwal, computing systems that are not in use could revert to a hybrid active-passive state, using only one to two percent of their normal power usage, while still allowing these computer to perform very basic functions and know how to seamlessly ‘wake up’ whenever needed.
“You want machines that can effectively talk in their sleep and thus stay connected,” said Agarwal, only half-jokingly. “If every PC and server could revert to a ‘sleep-talking’ state, the IT equipment would also generate much less heat, and that would translate into further savings on air conditioning and climate-control systems. We estimate that the CSE building energy use could be cut in half.”
With support from the campus, CSE and Calit2, Agarwal and his colleagues in the Microelectronic Embedded Systems Laboratory are working to prove that estimate by enabling this “hybrid sleep” option for desktop PCs and servers across the CSE department as a pilot deployment. To enable this functionality, a few participants in the study are using “Somniloquy,” a dedicated USB hardware dongle that was previously developed by Agarwal and his colleagues and widely covered by the media. Furthermore, a significant number of users are now employing “SleepServer,” a software-only version of the energy-saving architecture developed recently by Agarwal, who is scheduled to present a paper on the technology in Boston at the 2010 USENIX Annual Technical Conference in June.
To improve the value of data in the UC San Diego Energy Dashboard, they are also working with a private company on a less expensive plug-level meter. Today individual meters that can monitor energy use remotely cost approximately $200 each; Agarwal thinks that if they can get that price down to the $30-$50 range, individuals wanting to track their own carbon footprint will be happy to invest in a meter that would transmit its real-time data to the Energy Dashboard, where the user would be able to use the portal’s tools to track their own usage – and even compare it to the energy profile of a colleague in the next office. “Working with a set of very creative and intelligent students, and leveraging their talent to address some of the energy issues of today, is also immensely satisfying since it feels like you are solving a real-world problem in the end,” said Agarwal. Among the graduate students working on the Energy Dashboard project: Ph.D. student Thomas Weng, a co-author on the November 2009* paper with Agarwal and Gupta.
According to Agarwal, his group is now working on an Energy Dashboard API that will make it possible for anyone at UC San Diego to integrate their own power meter into the dashboard and take advantage of its visualization and comparison features. In the longer term, the researchers are looking into ways to release the API to the larger community outside of UC San Diego, so that anyone with the appropriate energy meter can post, visualize and compare their energy use data on an externally available Energy Dashboard.
* “The Energy Dashboard: Improving the Visibility of Energy Consumption at a Campus-Wide Scale,” Yuvraj Agarwal, Thomas Weng, Rajesh Gupta, First ACM Workshop on Embedded Sensing Systems For Energy-Efficiency In Buildings, November 2009.
“Somniloquy: Augmenting Network Interfaces to Reduce PC Energy Usage,” Yuvraj Agarwal, Steve Hodges, James Scott, Ranveer Chandra, Paramvir Bahl, and Rajesh Gupta. In Proceedings of USENIX Symposium on Networked Systems Design and Implementation (NSDI ’09), April 2009.
“SleepServer: A Software-Only Approach for Reducing the Energy Consumption of PCs within Enterprise Environments,” Yuvraj Agarwal, Stefan Savage, and R. Gupta.
To Appear at the USENIX Annual Technical Conference (USENIX '10), June 2010.
###
Story written by Doug Ramsey, Calit2 at UCSD.
Media Contacts
Doug Ramsey
Jacobs School of Engineering
858-822-5825
dramsey@ucsd.edu
Daniel Kane
Jacobs School of Engineering
858-534-3262
dbkane@ucsd.edu